Microsoft DP-600 Übungsprüfungen
Zuletzt aktualisiert am 26.04.2025- Prüfungscode: DP-600
- Prüfungsname: Microsoft Fabric Analytics Engineer
- Zertifizierungsanbieter: Microsoft
- Zuletzt aktualisiert am: 26.04.2025
HOTSPOT
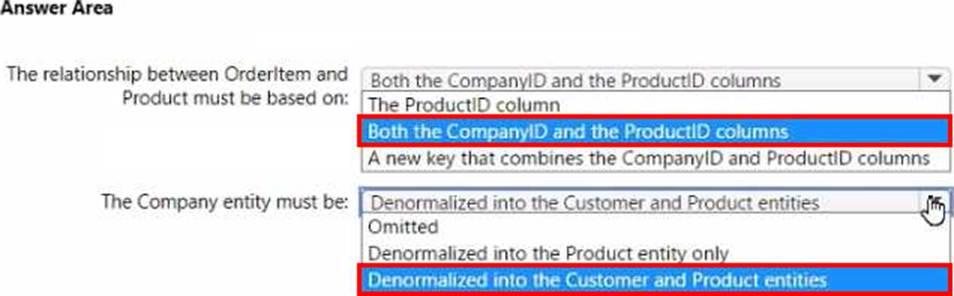
You have the source data model shown in the following exhibit.
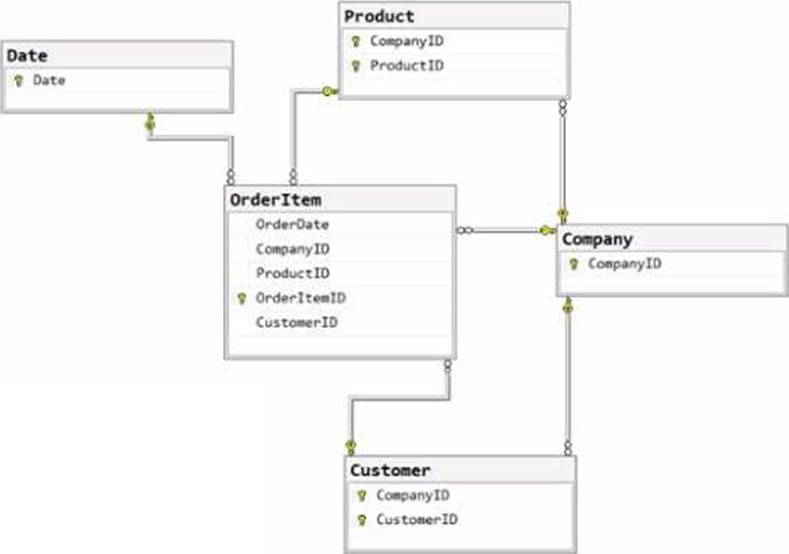
The primary keys of the tables are indicated by a key symbol beside the columns involved in each key.
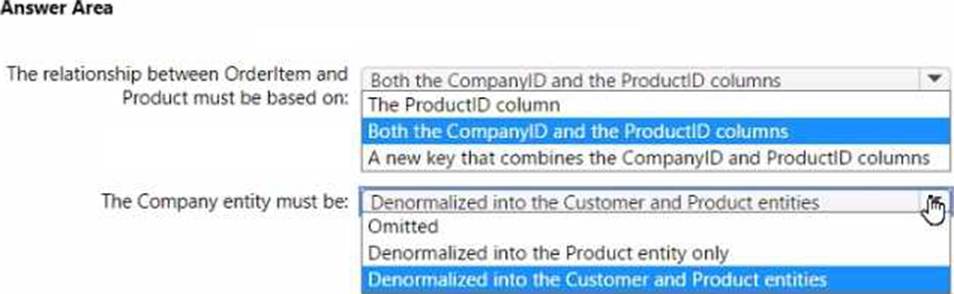
You need to create a dimensional data model that will enable the analysis of order items by date, product, and customer.
What should you include in the solution? To answer, select the appropriate options in the answer
area. NOTE: Each correct selection is worth one point.
DRAG DROP
You are implementing two dimension tables named Customers and Products in a Fabric warehouse.
You need to use slowly changing dimension (SCO) to manage the versioning of data.
The solution must meet the requirements shown in the following table.
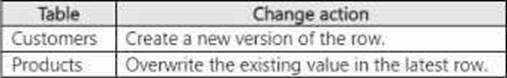
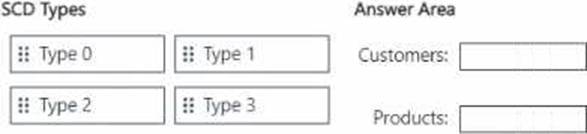
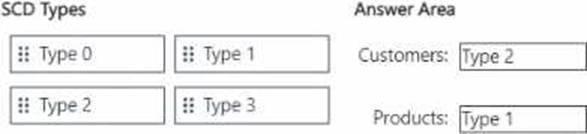
Which type of SCD should you use for each table? To answer, drag the appropriate SCD types to the correct tables. Each SCD type may be used once, more than once, or not at all. You may need to drag the split bar between panes or scroll to view content. NOTE: Each correct selection is worth one point.
You have a Fabric tenant that contains a semantic model.
You need to prevent report creators from populating visuals by using implicit measures.
What are two tools that you can use to achieve the goal? Each correct answer presents a complete solution. NOTE: Each correct answer is worth one point.
- A . Microsoft Power BI Desktop
- B . Tabular Editor
- C . Microsoft SQL Server Management Studio (SSMS)
- D . DAX Studio
You have a Fabric tenant
You are creating a Fabric Data Factory pipeline.
You have a stored procedure that returns the number of active customers and their average sales for the current month.
You need to add an activity that will execute the stored procedure in a warehouse. The returned values must be available to the downstream activities of the pipeline.
Which type of activity should you add?
- A . Switch
- B . Lookup
- C . Append variable
- D . KQL
You have a Fabric tenant that contains a complex semantic model. The model is based on a star schema and contains many tables, including a fact table named Sales. You need to create a diagram of the model. The diagram must contain only the Sales table and related tables.
What should you use from Microsoft Power Bl Desktop?
- A . data categories
- B . Data view
- C . Model view
- D . DAX query view
You have a Fabric tenant that contains a lakehouse named Lakehouse! Lakehouse1 contains a Delta
table that has one million Parquet files.
You need to remove files that were NOT referenced by the table during the past 30 days. The solution must ensure that the transaction log remains consistent, and the ACID properties of the table are maintained
What should you do?
- A . Run the optimize command and specify the v-order parameter.
- B . Run theOPTiMize command and specify the z-order parameter
- C . Run the vacuum command.
- D . From OneLake file explorer, delete the files.
You have a Fabric workspace named Workspace1 that contains a data flow named Dataflow1.
Dataflow1 contains a query that returns the data shown in the following exhibit.
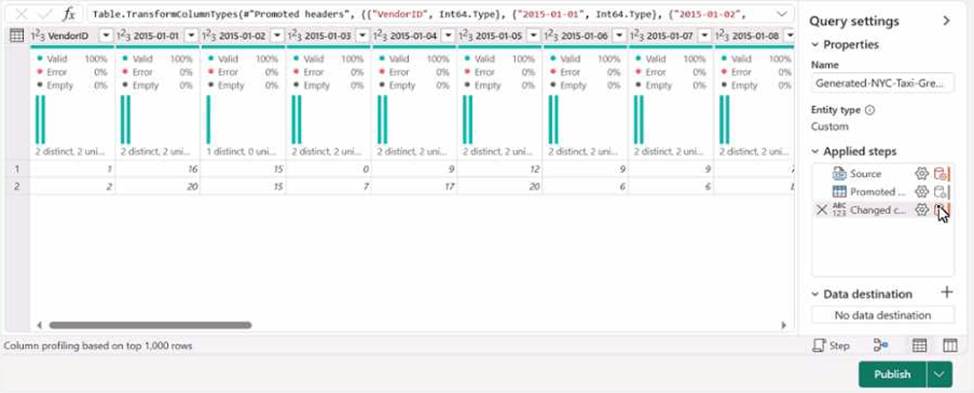
You need to transform the date columns into attribute-value pairs, where columns become rows.
You select the VendorlD column.
Which transformation should you select from the context menu of the VendorlD column?
- A . Group by
- B . Unpivot columns
- C . Unpivot other columns
- D . Split column
- E . Remove other columns
You have a Fabric tenant tha1 contains a takehouse named Lakehouse1. Lakehouse1 contains a Delta table named Customer.
When you query Customer, you discover that the query is slow to execute. You suspect that maintenance was NOT performed on the table.
You need to identify whether maintenance tasks were performed on Customer.
Solution: You run the following Spark SQL statement:
EXPLAIN TABLE customer
Does this meet the goal?
- A . Yes
- B . No
You are analyzing the data in a Fabric notebook.
You have a Spark DataFrame assigned to a variable named df.
You need to use the Chart view in the notebook to explore the data manually.
Which function should you run to make the data available in the Chart view?
- A . displayMTML
- B . show
- C . write
- D . display
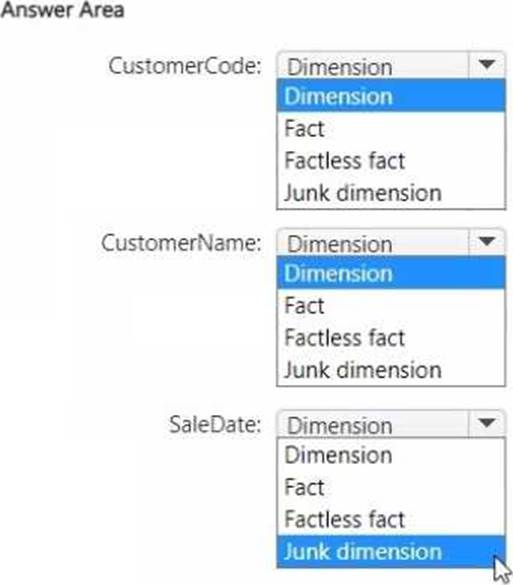
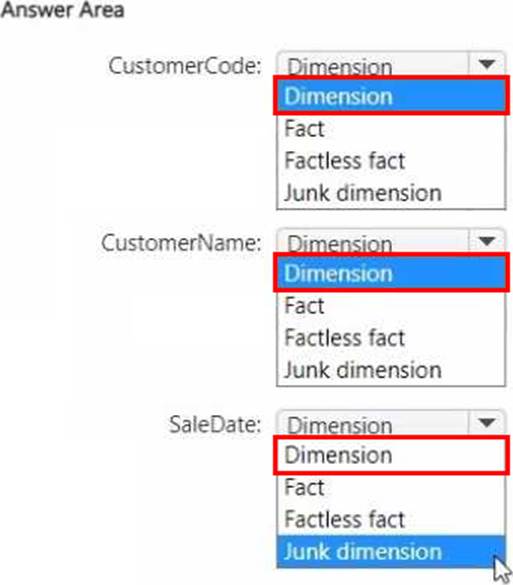
HOTSPOT
You have source data in a CSV file that has the following fields:
• SalesTra nsactionl D
• SaleDate
• CustomerCode
• CustomerName
• CustomerAddress
• ProductCode
• ProductName
• Quantity
• UnitPrice
You plan to implement a star schema for the tables in WH1. Thedimension tables in WH1 will implement Type 2 slowly changing dimension (SCD) logic.
You need to design the tables that will be used for sales transaction analysis and load the source data.
Which type of target table should you specify for the CustomerName, CustomerCode, and SaleDate fields? To answer, select the appropriate options in the answer area. NOTE: Each correct selection is worth one point.