Microsoft PL-300 Übungsprüfungen
Zuletzt aktualisiert am 26.04.2025- Prüfungscode: PL-300
- Prüfungsname: Microsoft Power BI Data Analyst
- Zertifizierungsanbieter: Microsoft
- Zuletzt aktualisiert am: 26.04.2025
You need to recommend a strategy to consistently define the business unit, department, and product category data and make the data usable across reports.
What should you recommend?
- A . Create a shared dataset for each standardized entity.
- B . Create dataflows for the standardized data and make the dataflows available for use in all imported datasets.
- C . For every report, create and use a single shared dataset that contains the standardized data.
- D . For the three entities, create exports of the data from the Power Bl model to Excel and store the data in Microsoft OneDrive for others to use as a source.
DRAG DROP
You build a report about warehouse inventory data. The dataset has more than 10 million product records from 200 warehouses worldwide.
You have a table named Products that contains the columns shown in the following table.
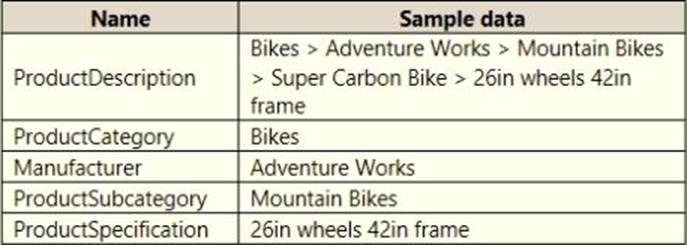
Warehouse managers report that it is difficult to use the report because the report uses only the product name in tables and visuals. The product name is contained within the ProductDescription column and is always the fourth value.
You need to modify the report to support the warehouse managers requirement to explore inventory levels at different levels of the product hierarchy. The solution must minimize the model size.
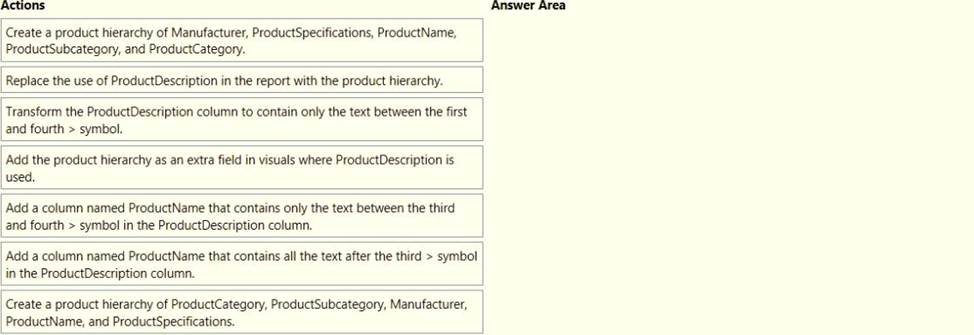
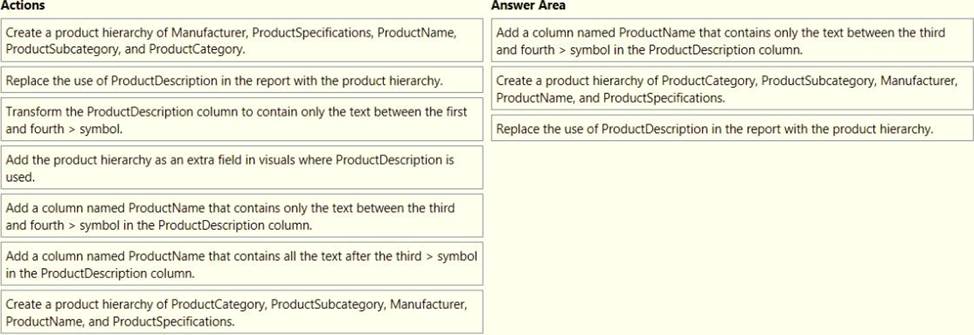
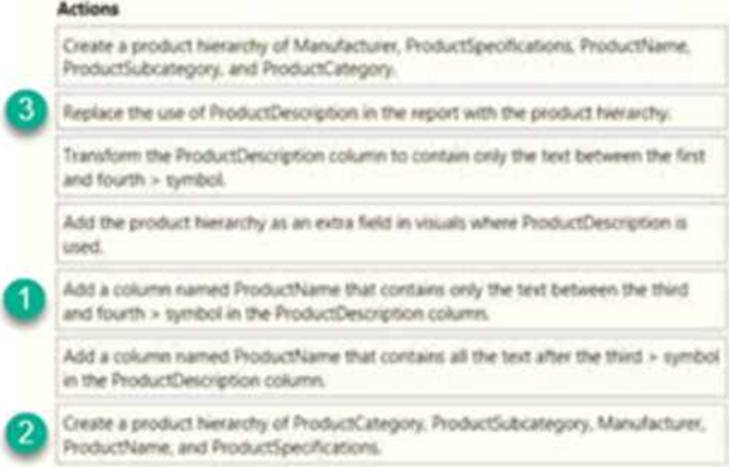
Which three actions should you perform in sequence? To answer, move the appropriate actions from the list of actions to the answer area and arrange them in the correct order.
You have a collection of reports for the HR department of your company. The datasets use row-level security (RLS). The company has multiple sales regions that each has an HR manager. You need to ensure that the HR managers can interact with the data from their region only. The HR managers must be prevented from changing the layout of the reports.
How should you provision access to the reports for the HR managers?
- A . Create a new workspace, copy the datasets and reports, and add the HR managers as members of the workspace.
- B . Publish the reports to a different workspace other than the one hosting the datasets.
- C . Publish the reports in an app and grant the HR managers access permission.
- D . Add the HR managers as members of the existing workspace that hosts the reports and the datasets.
You have an Azure SQL database that contains sales transactions. The database is updated frequently.
You need to generate reports from the data to detect fraudulent transactions. The data must be visible within five minutes of an update.
How should you configure the data connection?
- A . Add a SQL statement.
- B . Set Data Connectivity mode to DirectQuery.
- C . Set the Command timeout in minutes setting.
- D . Set Data Connectivity mode to Import.
You have a Microsoft SharePoint Online site that contains several document libraries. One of the document libraries contains manufacturing reports saved as Microsoft Excel files. All the manufacturing reports have the same data structure.
You need to load only the manufacturing reports to a table for analysis.
What should you do in Microsoft Power Bl Desktop?
- A . Get data from a SharePoint Online folder, enter the site URL, and then select Combine & Load.
- B . Get data from a SharePoint Online list and enter the site URL. Edit the query and filter by the path to the manufacturing reports library.
- C . Get data from a SharePoint Online folder and enter the site URL. Edit the query and filter by the path to the manufacturing reports library.
- D . Get data from a SharePoint Online list, enter the site URL, and then select Combine & Load.
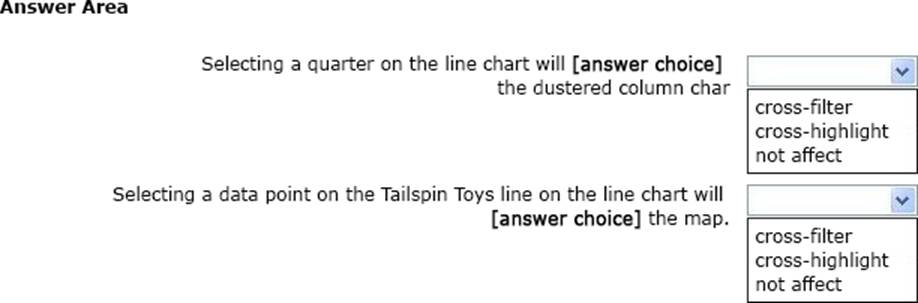
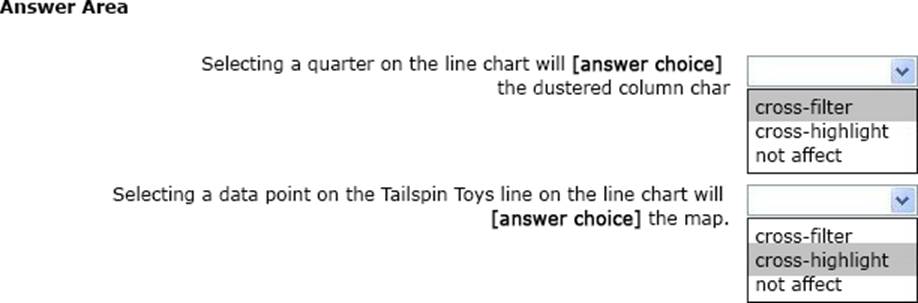
HOTSPOT
You have a report page that contains the visuals shown in the following exhibit.
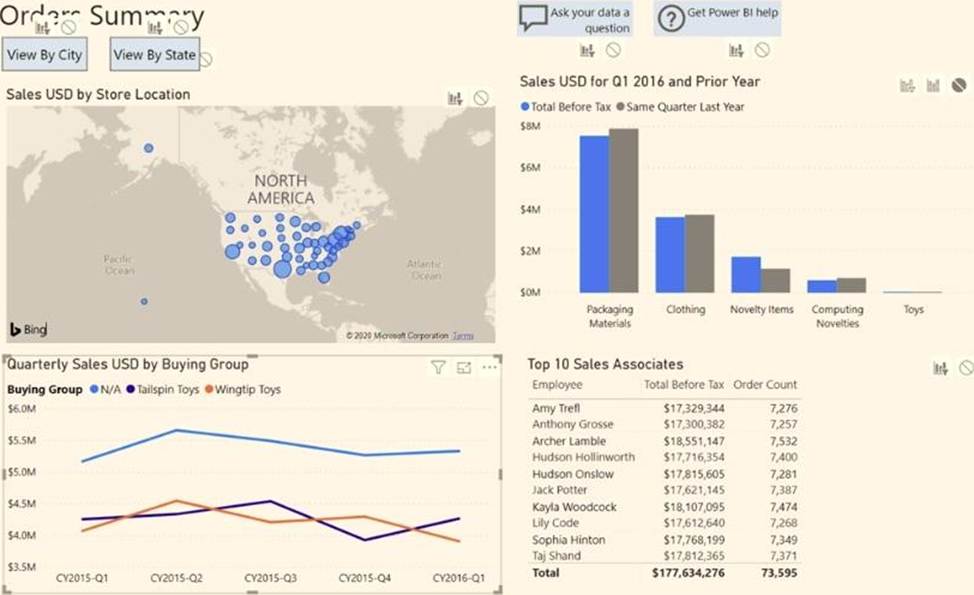
Use the drop-down menus to select the answer choice that completes each statement based on the information presented in the graphic. NOTE: Each correct selection is worth one point.
You have the tables shown in the following table.
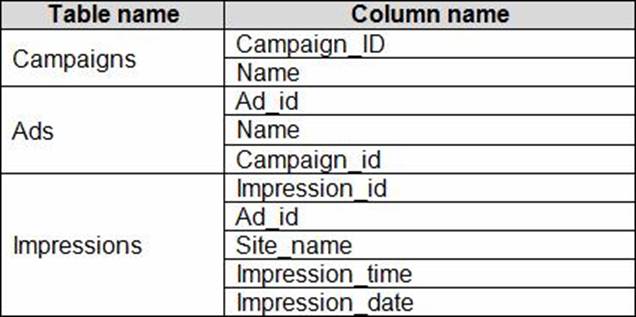
The Impressions table contains approximately 30 million records per month.
You need to create an ad analytics system to meet the following requirements:
✑ Present ad impression counts for the day, campaign, and Site_name. The analytics for the last year are required.
✑ Minimize the data model size.
Which two actions should you perform? Each correct answer presents part of the solution. NOTE: Each correct selection is worth one point.
- A . Group the impressions by Ad_id, Site_name, and Impression_date. Aggregate by using the CountRows function.
- B . Create one-to-many relationships between the tables.
- C . Create a calculated measure that aggregates by using the COUNTROWS function.
- D . Create a calculated table that contains Ad_id, Site_name, and Impression_date.
You are developing a report page. Some users will navigate the report by using a keyboard, and some users will consume the report by using a screen reader. You need to ensure that the users can consume the content on a report page in a logical order.
What should you configure in Microsoft Power Bl Desktop?
- A . the bookmark order
- B . the layer order
- C . the tab order
- D . the X position